Pixel Art Sonification: 10 steps (with pictures)
Pixel Art is digital art created with software that manipulates images at the pixel level. Examples of this art can be found in 8-bit and 16-bit computers, video game consoles, and graphing calculators.
The goal of this activity is to explore pixel art through data science, specifically data visualization and sonification. Data visualization is the graphical representation of information and data. By using visual elements like charts, graphs, and maps, data visualization tools provide an accessible way to spot and understand patterns in data. If you have time, have students watch this video:
Students use Google Sheets and conditional formatting to create pixel art, and then use the Two Tone application to take that data and use it to create sound. In Two Tone they can Pixelart-Information translated into pitch, volume, tempo, etc.
As a final step, students will share their work with their classmates and others.
Step 1: Data Science Icebreaker
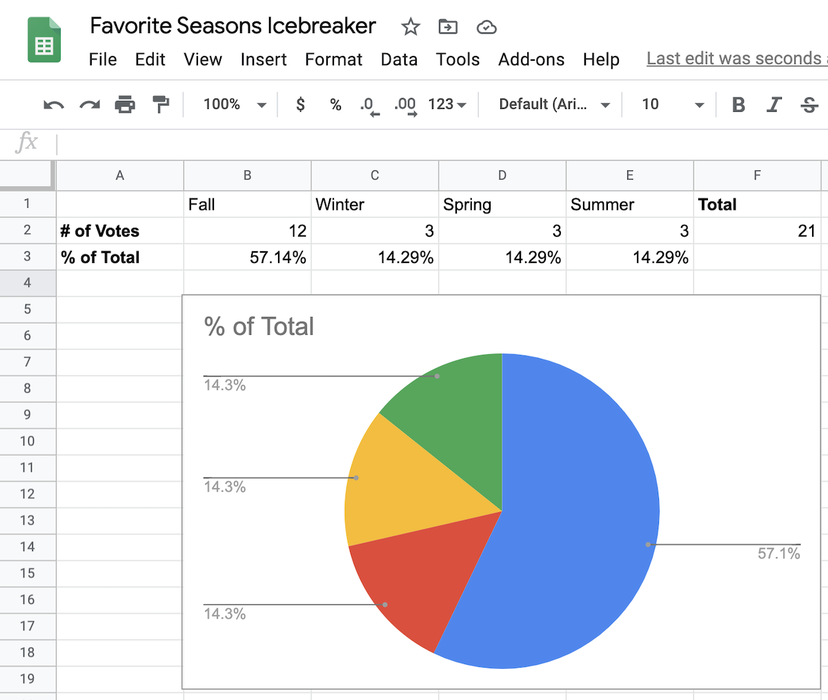
Data Visualization is the graphical representation of data. It involves producing images that convey to viewers relationships between the data presented. Bar and pie charts are two of several types of data viz.
For this 10-minute icebreaker, have students write their favorite season of the year on a note card and add them to a pile. Collect and separate all votes based on each season. When working remotely, let students write their responses in the chat area of the virtual classroom program. Enter the results in a spreadsheet (or use the attached file) and share the results with the class.
To add another layer to this icebreaker, you could have students guess others' favorite seasons based on their hobbies or other interests.
What can the students conclude about their classmates from the resulting data? Which season is the most popular? What does the data visualization show?
Step 2: Build Pixel Art with Google Sheets
![]()
The main activity comes from Make Art with Google Sheets. Students will learn how to create data visualizations (as pixel art) based on conditional formatting.
Students create their own pixel graphics in Google Sheets or Excel.
First, have the students watch the introduction (3-minute video).
What other examples of pixel art have students seen prior to this class or session?
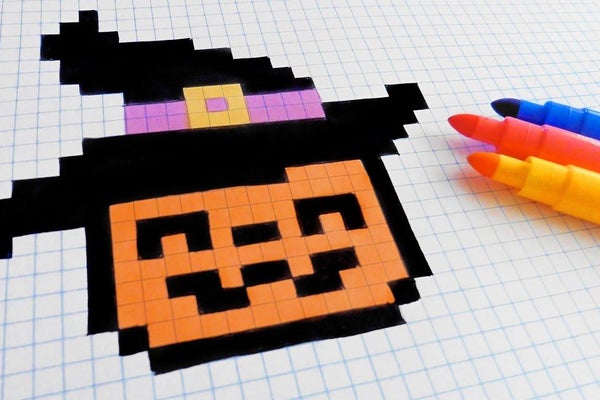
Step 3: Create your grid and choose an image
In this step, students will use Google Sheets with conditional formatting to add colors and shading to highlight data that meets certain conditions or rules. First, have students launch Google Sheets from their Google drives and name their projects.
For Distance Learning: Have students work in smaller groups to complete the artwork in less time.
Watch this video tutorial (2:27 mins) and follow these steps (10 mins)
- Set up your spreadsheet by selecting all the cells in your sheet - click the box at the top left above the spreadsheet (see photo).
- Resize all cells to form a grid in your spreadsheet.
- Look for spreadsheet pixel art (or based on a theme like Halloween).
- Customize your search and filter your results if needed.
- Choose an image to inspire your project.
- Open your mission statement in a new browser tab.
Step 4: Create a color palette with conditional formatting
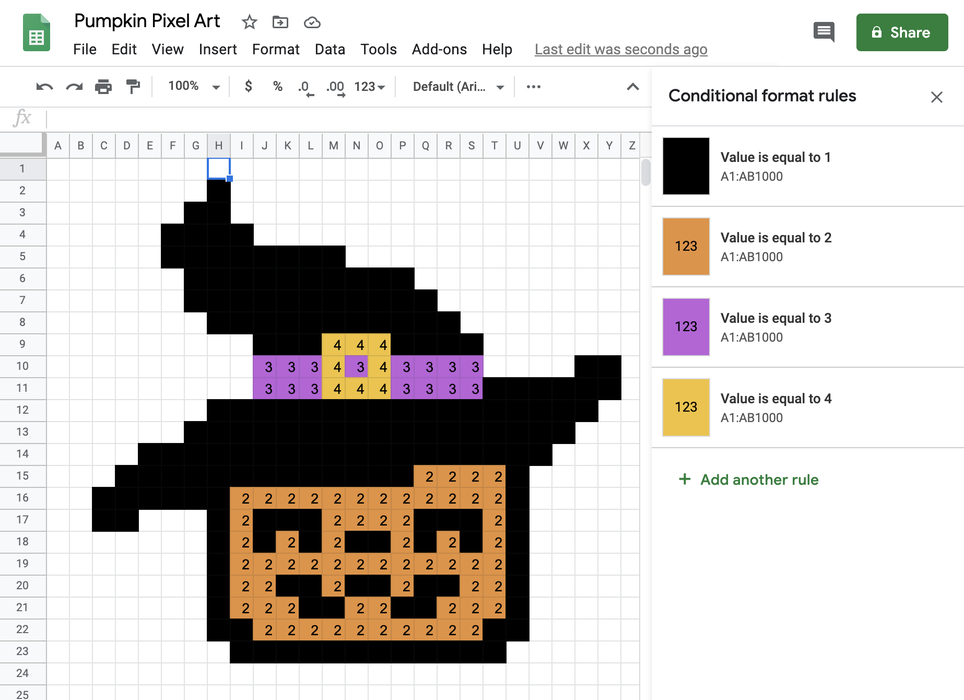
In this step, students will use conditional formatting to create a color palette for their art. Have students make a list of the colors they see in their pixel art image.
Watch the video tutorial (3:30 min) and follow these steps (10 min):
- Select all cells in the table.
- Open conditional formatting.
- Create a rule for each color in the image.
- Check the work by adding colors to the project.
If time is tight, students can work in smaller groups on a pixel art project.
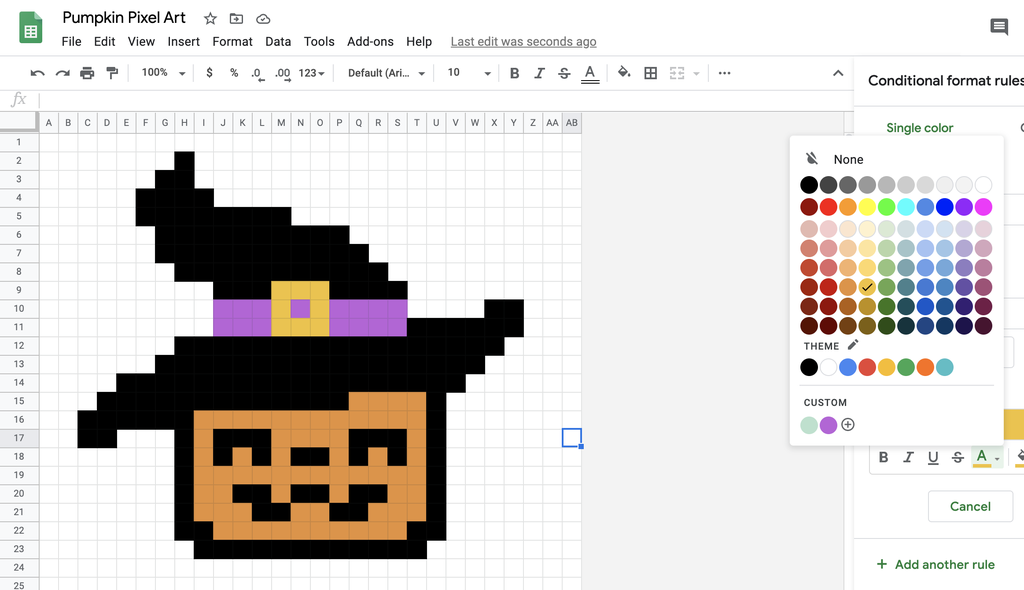
Step 5: Create your image
In this step, students will create their pixel art image.
Watch this video tutorial (2:32 mins) and follow these steps (15-20 mins):
- Open the conditional formatting rules to see your color values.
- Add values to color cells in your spreadsheet.
- Complete your picture.
- Choose a custom area for your background.
- Add a new rule to set a background color.
Working in small groups allows students to get more done in less time. If you are working remotely, this can be accomplished in "breakout" groups.
Step 6 Adjust text and fill colors and remove grid lines
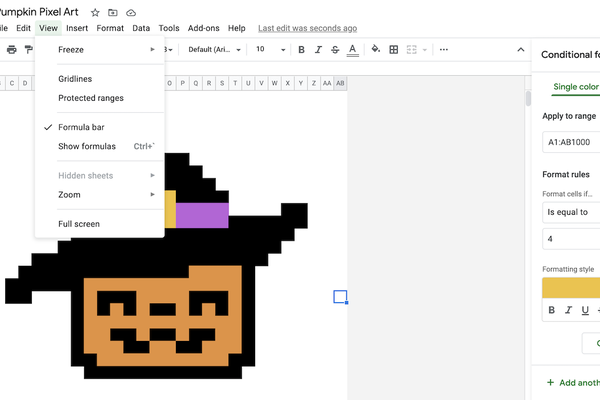
In this step, students will change the text colors (numbers) to match the cell colors and remove the gridlines.
Watch this video tutorial (2:00 mins) and do the following steps (5 mins):
- Select all cells and open conditional formatting.
- Revise conditional formatting rules to match text colors to fill colors.
- Remove the gridlines from your spreadsheet.
- Rename your table.
When the students are done, they should take screenshots of the final pixel art that will be used in the last step.
Step 7: Import the file into Two Tone App
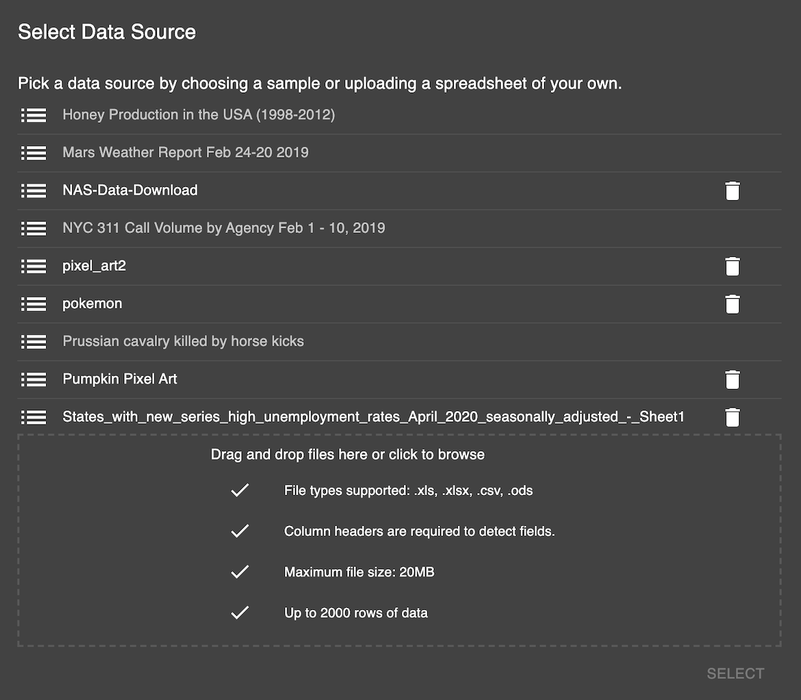
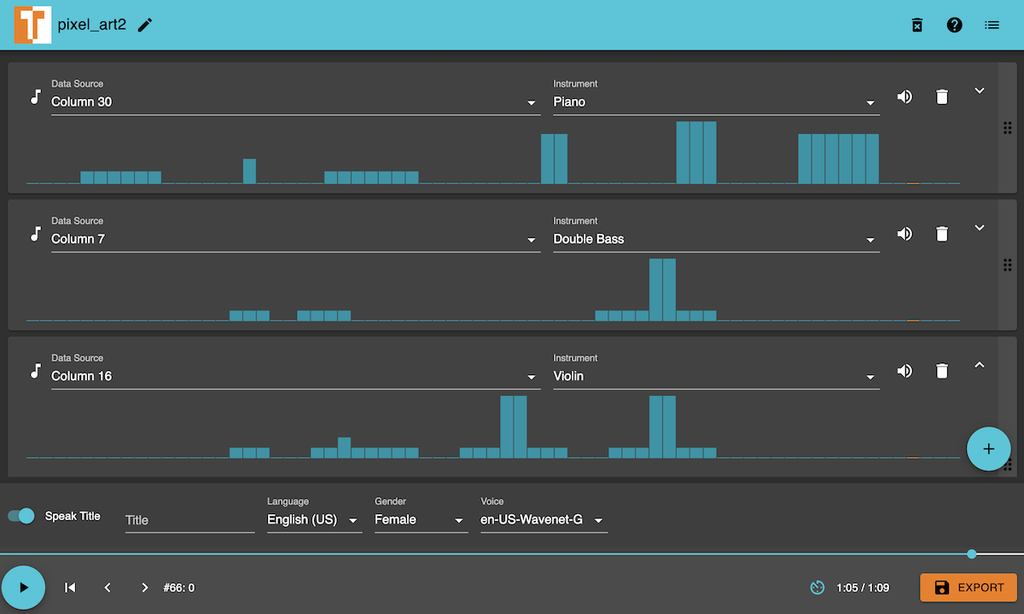
TwoTone is an online application that uses ultrasound , so you can hear data. Sonification is the use of audio to convey information or perceive data. As a next step, students import their Google Sheet/Excel bitmap (.xls. or .csv file format) into Two Tone. You can drag and drop your files or click the box at the bottom of the gray window to browse and find your file(s).
Step 8: Create music with data
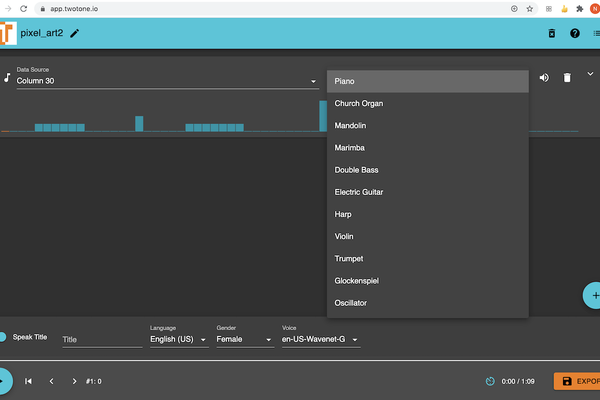
Two Tone allows students to select different data sources (columns) from their pixel art table and select instruments for each source. You can click the blue "+" button and the music note button at the bottom right of the application window to add more data sources.
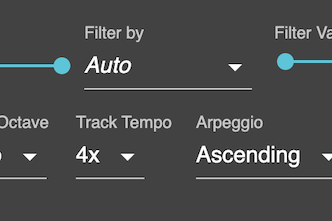
The small arrows on the right side of each data source expand to reveal more options, such as: B. changing the key or tempo of the instrument while it is playing.
Students should explore and add 4-5 sources/instruments (10 min).
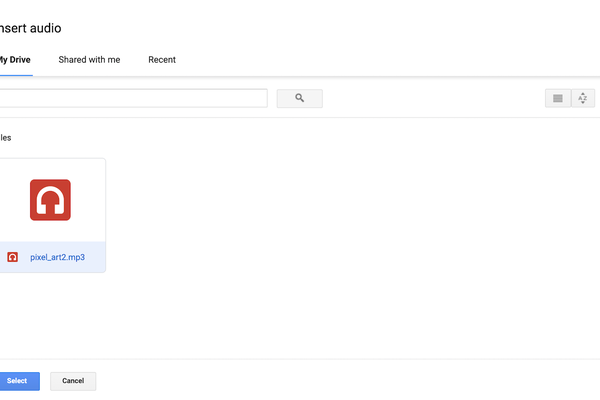
Step 9: Export Music as MP3
After students have created their music, they can download it as an MP3 file by clicking the orange export button in the lower right corner of the application window. Students must do this for the next and final step.
Step 10: Create your final presentation
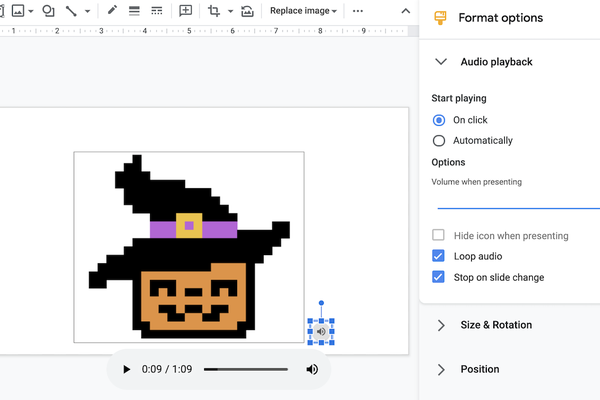
As a final step, students can use Google Slides to create a slide presentation of their pixel art and music. This shouldn't take longer than 10 minutes.
- Upload the saved MP3 file to your drive
- Start Google Slides
- Paste the pixel art image (saved screenshot of the pixel art)
- Click Insert > Audio
- Locate and select the MP3 file
- In the Format Options box, click Loop Audio.
- Add your name to the file (student name, project name)
Students can take part in a gallery tour: view and listen to other students' projects. This can also be done remotely by sharing screens.